

Heating Utility Data Collection and Regulatory Reporting for Multi-Level Heat Exchange Stations
During heating operations, the central control room needs visibility into pressure, temperature, flow and valve status at heat exchange stations of different levels. Government regulatory platforms also need to receive operating data as required. When field data is scattered across control cabinets, instruments and separate systems, operators have to check operating conditions and prepare reports, often processing the same data repeatedly.
Consider a heating utility using staged heat exchange: each heat exchange station transfers heat from the upstream network to the network served at that level, which then transports the heat onward. This article uses the station-level relationships below. The workflow is an illustrative scenario, not a record of an implemented customer project.
| Heat exchange station level | Upstream network side | Network side served at this level | Heat transfer relationship |
|---|---|---|---|
| Level 1 station | Network 1 | Network 2 | Heat transfers from network 1 to network 2 |
| Level 2 station | Network 2 | Network 3 | Heat transfers from network 2 to network 3 |
| Level 3 station | Network 3 | Network 4 | Heat transfers from network 3 to network 4 |
These are the respective heat transfer relationships at stations of different levels, not networks 1, 2 and 3 all located within a single station. Each station collects data separately from its upstream network side and the network side served at that level. The two sides of the heat exchanger transfer heat without directly mixing water; station level, site and network assignment must all be identified.
Collect Operating Data from Both Sides of Each Heat Exchange Station
Before integration, organize the data by station level, site, upstream network side / network side served at this level, equipment and measurement point, rather than mixing all pressure and temperature variables together. For example, “Level 2 station A — upstream network side (network 2) — water inlet pressure” and “Level 2 station A — network side served at this level (network 3) — water outlet pressure” are different measurement points. Labels such as “network 2 pressure” or “network 3 pressure” cannot replace the site and measurement location.
| Data category | Measurement points defined separately on both sides of each station | Distinctions to preserve in use |
|---|---|---|
| Pressure | Water inlet pressure and water outlet pressure | Measurement location, unit, and whether pressure is gauge or absolute |
| Temperature | Water inlet temperature and water outlet temperature | Sensor location and the site-specific definitions of inlet and outlet |
| Flow | Flow at agreed locations on the upstream network side and the network side served at this level | Separate instantaneous flow rate from accumulated volume; neither replaces the other |
| Valves | Available variables such as open/closed status, position feedback and fault status | Keep actual feedback separate from control setpoints and collect only what the equipment supports |
| Other operating indicators | Additional site-specific data such as circulation pump status, frequency or equipment faults | Use only the data actually provided by the equipment |
The Woody industrial smart gateway reads these data through communication interfaces made available by the equipment. For example, if a site PLC already collects pressure, temperature and flow signals, the gateway can read its variables using a compatible PLC protocol. If instruments provide Modbus RTU or Modbus TCP interfaces, acquisition is configured according to their register maps.
Sensors with only analog outputs and no communication interface must first connect to a suitable PLC or data acquisition module. The gateway's serial and Ethernet ports are not analog inputs. For separate sites or equipment networks that cannot communicate directly with one another, deploy acquisition gateways according to the actual network boundaries; do not assume that one gateway can cover the entire operation.
After acquisition, standardize field names, units, range scaling and timestamps as agreed for the project, while retaining communication status, data validity and the last update time. Equipment disconnections and stale data must be handled explicitly in both display and reporting logic. Old values must not be presented as current readings, and zero values must not be used to disguise missing samples as normal measurements.
Display Operations in the Control Room and Send Reports to the Regulator
The point of this solution is not simply to put data online, but to deliver the collected data to two clearly defined uses.
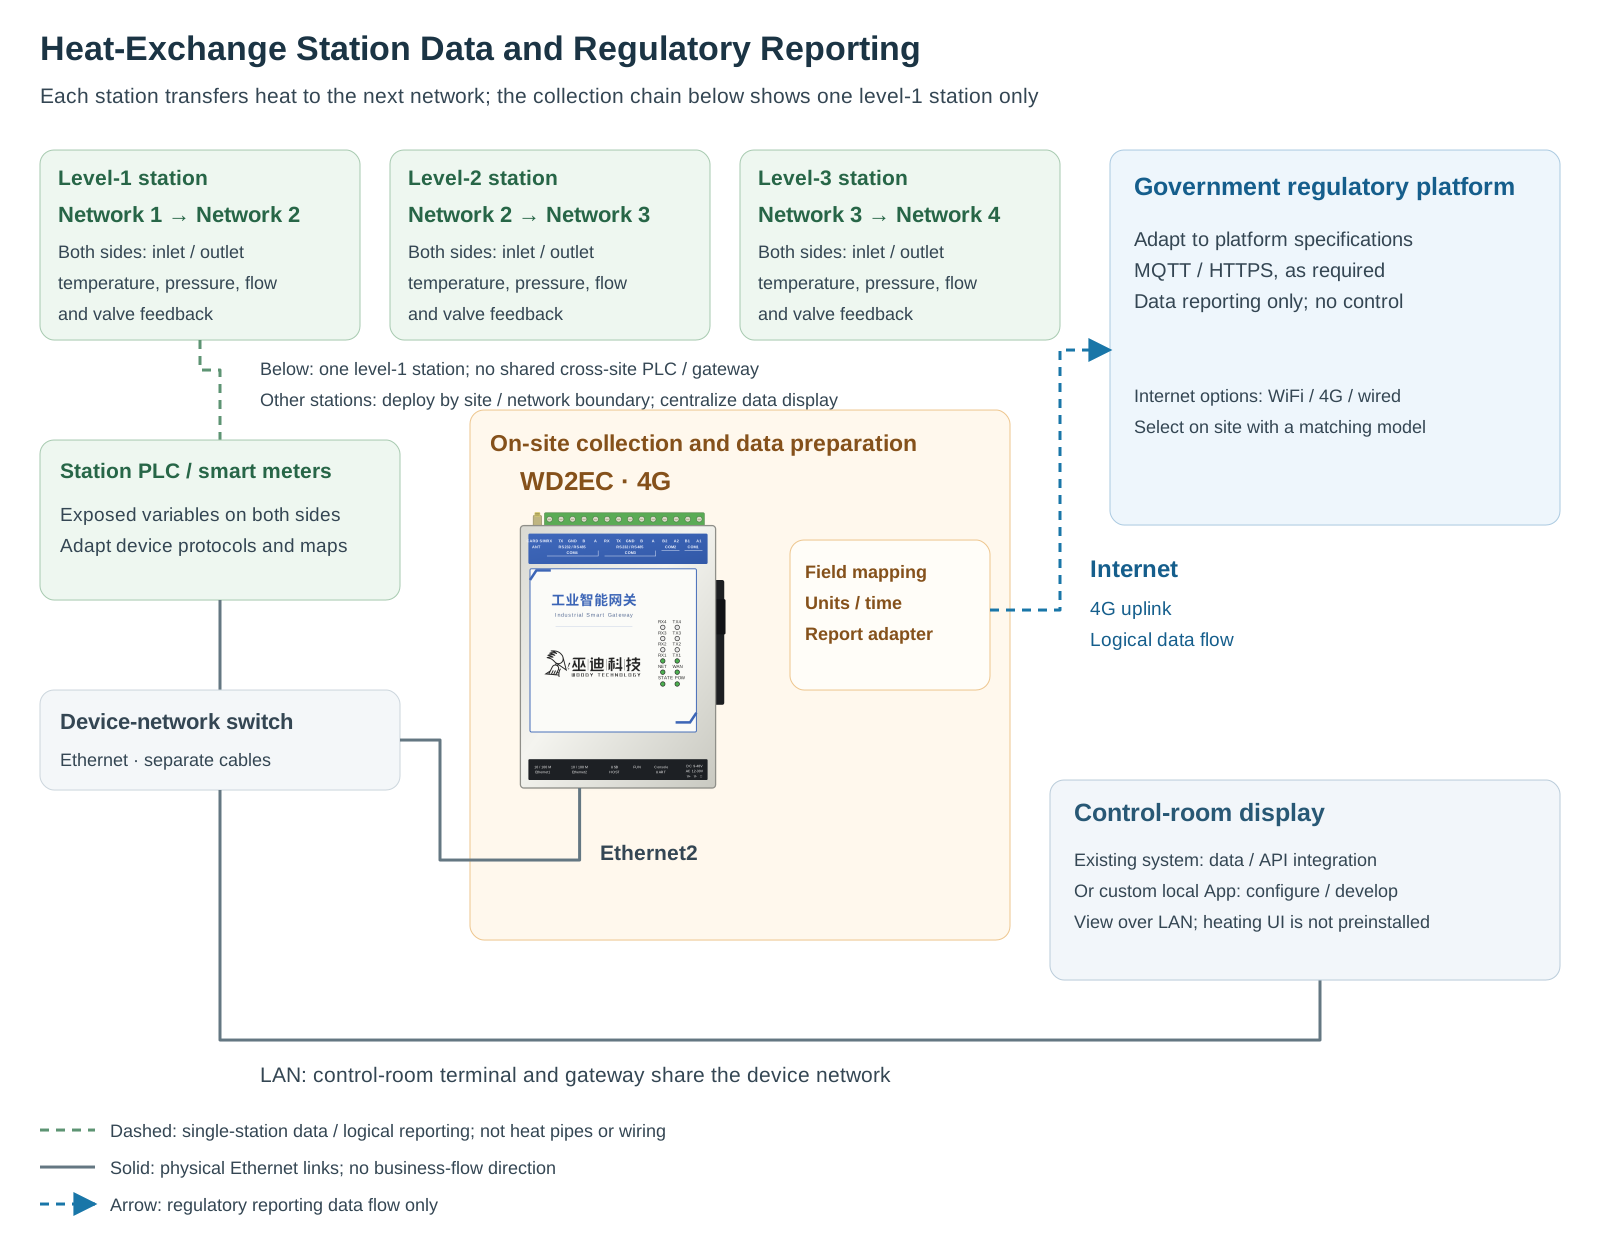
Centralized Display by Station Level, Site and the Networks on Both Sides
Where SCADA software or a heating monitoring system is already in place, the gateway's collected data can be integrated into that system through protocols or interfaces supported by both sides. The existing system provides screens, trends and operational views, avoiding a separate interface solely for the added data acquisition.
Where no suitable interface exists, the gateway's local App framework can also be used to develop operating dashboards and trend pages for the project. These can be viewed in a browser on a control room terminal with authorized network access. The pages, historical records and abnormal-condition notifications require configuration or development. Connecting equipment does not automatically provide a complete heating dispatch system, and historical data retention must be planned around available storage resources.
For a local App view of a single heat exchange unit at a level 1 station, supply and return temperatures and pressures, flow on the upstream network side (network 1) and the network side served at this level (network 2), control valve position, circulation pump status and make-up water measurement points can be placed near the corresponding equipment. Operators can then follow the piping to inspect the data. “Primary side” and “secondary side” in the interface refer to the two sides of this particular heat exchange unit, not fixed aliases for network numbers across the utility: at a level 2 station they correspond to networks 2 and 3; at a level 3 station, to networks 3 and 4. Calculated values such as temperature and pressure differences should be distinguished from instrument readings, with data validity and the last update time also displayed.
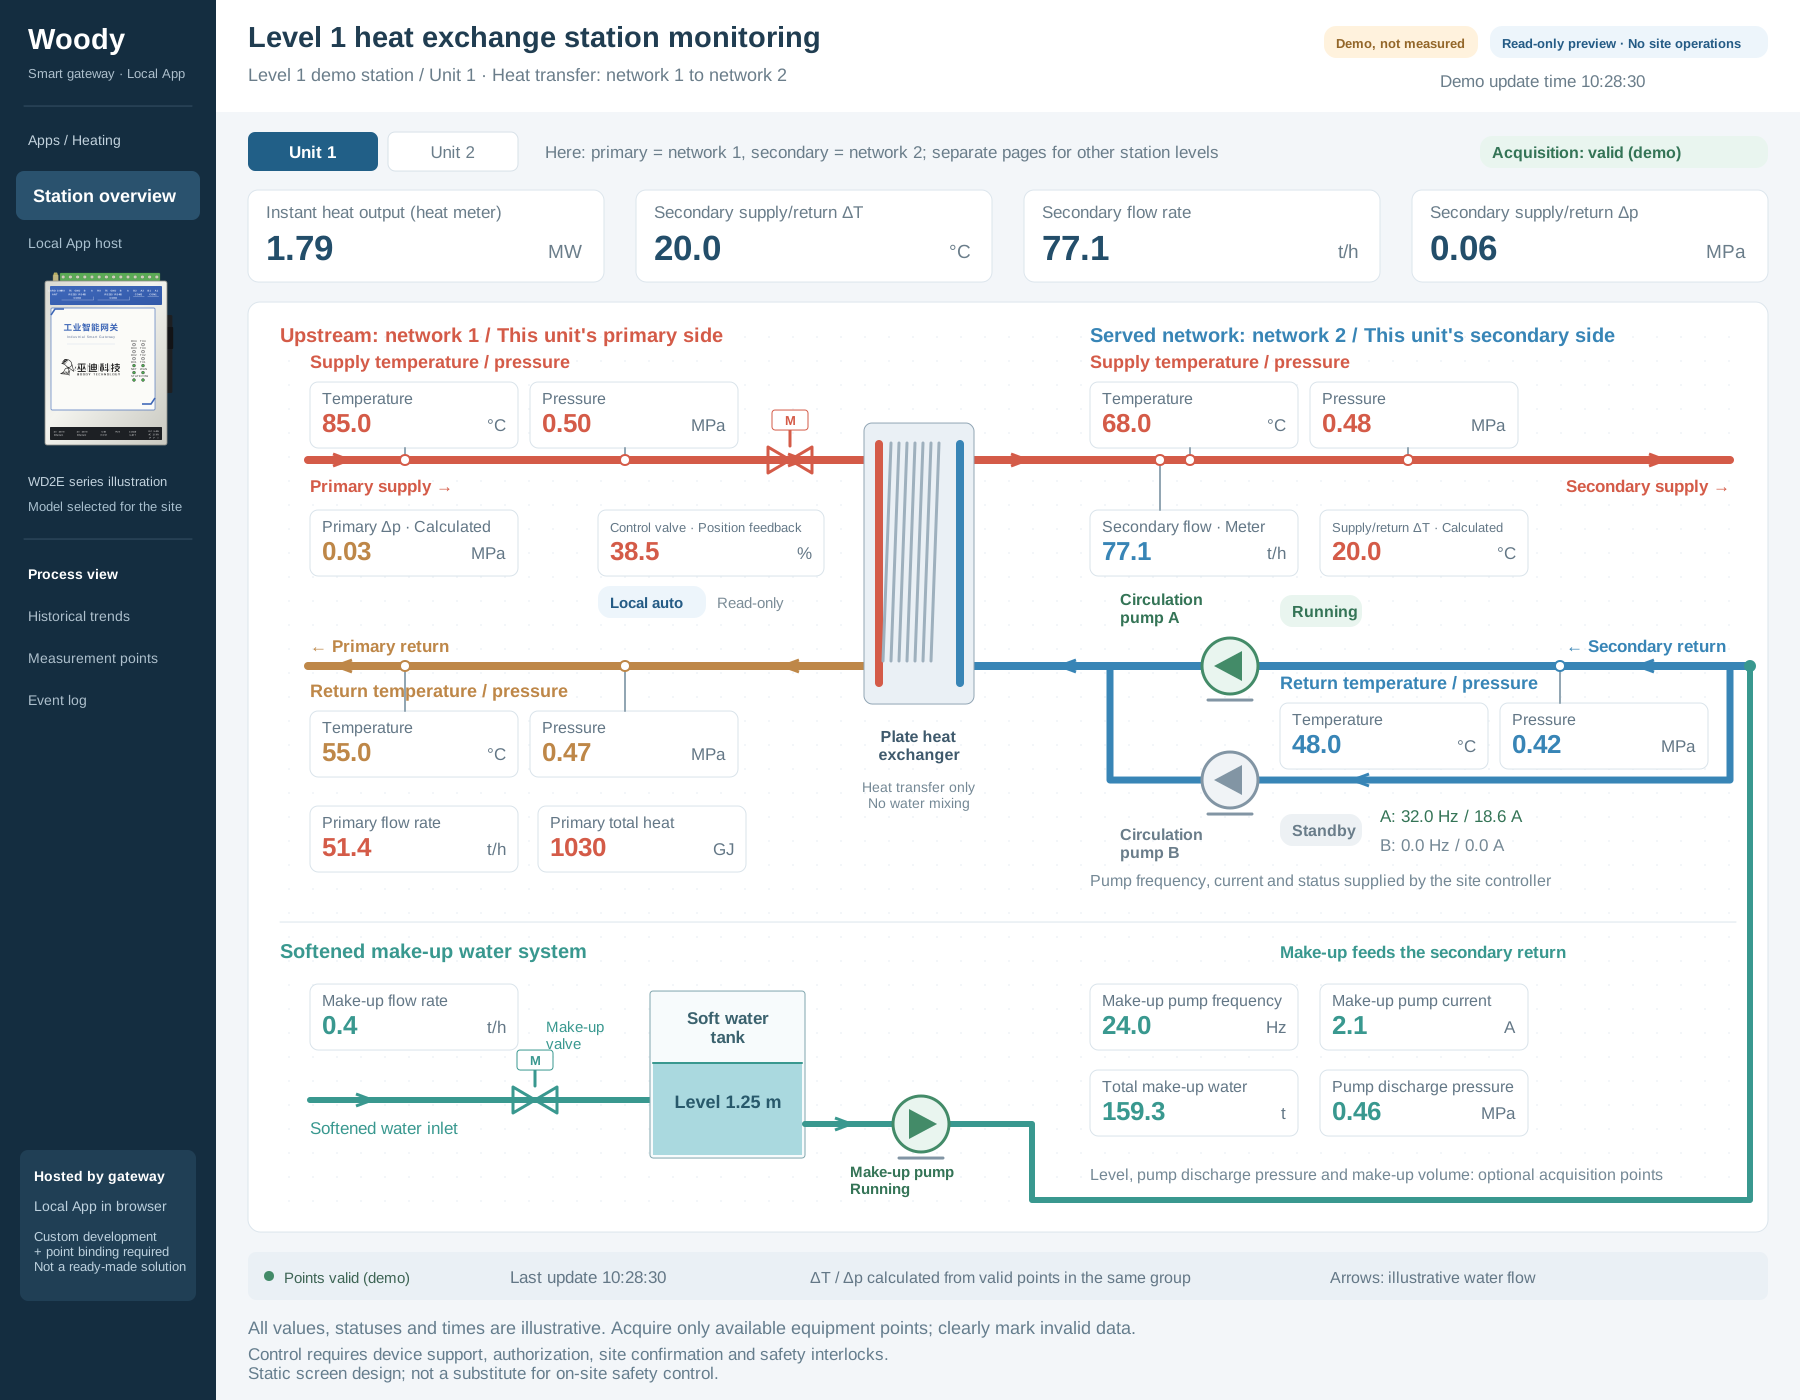
Open the original SVG to zoom in on measurement points and piping
All values, statuses and times shown are demonstration data. The screen is a read-only design illustration that requires custom development and binding to actual measurement points, not an operating interface connected to a site. It shows only one network 1 / network 2 heat exchange circuit pair at a level 1 station. It does not include the network 2 / network 3 circuit at a level 2 station or the network 3 / network 4 circuit at a level 3 station. Stations at other levels require their own site and unit pages; the network labels in this illustration must not simply be reused. Conditions and permissions for valve write operations are described below.
For example, if an operator notices a change in outlet water temperature on the network side served by a level 2 station (network 3), the operator can first compare temperature, pressure, flow and valve feedback on the upstream network side (network 2) on that station's page. Next, the operator can inspect circulation pumps and supply/return conditions on the network side served at that level, checking update times and communication status before deciding whether to contact the site for an inspection. The interface brings information together; a change in one value alone should not automatically be treated as a diagnosis of the fault's cause.
Government Platforms Receive Data According to Their Integration Specifications
The gateway's data publishing function can connect to platforms using MQTT, HTTP/HTTPS and other supported methods. Lua can also be used to implement field conversion and data push logic. However, the protocol and message format required by a government platform must follow the integration specifications actually provided by the relevant authority. Support for MQTT and HTTP does not mean that every regulatory platform can be connected without adaptation.
During integration, map utility, heat exchange station level, site, assigned network, heat exchange side and measurement-point identifiers to the platform's required fields. Then construct messages using the specified units, time formats, reporting intervals and authentication methods. Even measurement points belonging to network 2 must distinguish whether they are on the network side served by a level 1 station or the upstream network side of a level 2 station. They must not be merged across stations or substituted for one another. Real-time values, periodic statistics and accumulated quantities required by the regulator must be handled separately; an instantaneous sample is not a statistical result.
The control room display refresh interval and the regulatory reporting interval can differ and should be configured for their respective purposes. After transmission, process responses or acknowledgments according to the platform's interface rules. This allows maintenance staff to distinguish between data acquired, a request sent and data accepted by the platform, rather than checking only whether the gateway is online.
If the uplink fails, the gateway's offline buffering and resumable transmission capabilities can be incorporated into a backfill design. Buffer capacity, retention time, the sending rate after recovery, whether the platform permits historical backfill and how it handles duplicates must all be confirmed in advance. Backfilled records must retain their original acquisition timestamps rather than being relabeled as current data. Neither unlimited buffering nor zero data loss is promised.
The earlier data collection and reporting architecture diagram illustrates a WD2EC using 4G access. Internet connectivity can use WiFi, 4G or a wired connection, chosen by the customer to suit site conditions and matched to an appropriate model. If the regulatory platform requires a private network or a dedicated access channel, that requirement must be met; an ordinary internet connection is not a substitute.
Monitor Valve Feedback Without Granting Uncontrolled Access
Collecting valve status and changing valve position are different tasks. If monitoring is all that is required, collect only the available status and position feedback. A communication connection alone is not a reason to enable write access.
To meet the utility's valve control requirement, operators can adjust valves from the control room through an appropriately integrated control interface and gateway write channel. Operations require equipment support, authorized access, on-site confirmation and effective safety interlocks. First verify the target site, valve and permitted setpoint, then send the command and read back the actual position or status. A command being sent does not mean that the valve has reached its target position. The on-site PLC or controller remains responsible for local control and safety protection. The gateway does not replace safety interlocks, and the on-site control design must also specify valve behavior during a communication failure.
In this solution, the government platform's reporting interface only receives regulatory data; it does not thereby gain valve control permissions. Control room valve operations and regulatory reporting have separately configured permissions and workflows. Confirm writable variables, control methods and interlock conditions before implementation. A reporting path must not automatically become a control path.
Align Two Checklists Before Integration
The first is the field measurement-point checklist: establish the network 1 / network 2 relationship at level 1 stations, network 2 / network 3 at level 2 stations and network 3 / network 4 at level 3 stations. At each station, confirm inlet and outlet measurement locations on both sides, along with PLC or instrument models, protocols, variable addresses, read/write permissions, data units and validity rules.
The second is the platform integration checklist: define the control room system's interfaces and display requirements, along with the regulatory platform's identification rules, message structure, reporting interval, authentication, network channel, acknowledgment and backfill requirements. External reports must contain only approved data fields, and credentials and access rights must be managed according to project requirements.
Once these two checklists are aligned, the gateway collects and organizes field data and sends it as agreed. The control room system or a custom local App provides the display, while the government platform handles regulatory reception and its own business processing. The heating utility can then use the same measurement-point sources for operational viewing and regulatory reporting, reducing repeated transcription and preparation while maintaining clear data provenance, processing rules and control boundaries.